Q: We have seen impedance curve for products on your web site, but there was no frequency response curve provided, how was that? A: Take the composite impedance curve of Aragorn-Monitor for instance; It indicates a very stable impedance characteristic of the system. From 100Hz to 40KHz the resistance has been controlled to within 3.2 ohms within -0,+1 Ohms, a nearly perfect flatness impedance characteristic. This resistive load benefits system and crossover network stability. Please compare the curve with other products if you are interested to know the differences. 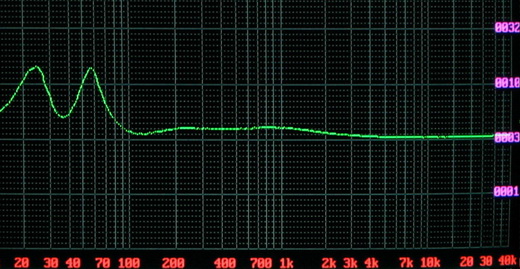
♥ Aragorn-Monitor has an excellent low frequency response characteristic. The curve shows system FB at 37Hz, tested system F3 is lower than 36Hz. This is a great achievement for a mid-sized bookshelf speaker! ♥ If we further analyze the two peaks (at 25Hz and 58Hz), we find Q factors are both within 0.7-1.0 and two peaks are about the same high meaning not only the bass is low enough with flat response but has good control of the bass quality. Many audiophiles have commented the outstanding bass performance after listening. As for the frequency response curve, different test method/ equipment may come out with different results. We employ tests mainly for design and quality control purposes. Every manufacturer shall optimize its system for best responding condition as much as possible. M&D considers frequency response characteristic as one of the important parameter among many. A true Hi-Fi system needs to take care a lot more (Please refer to our Introduction Manual). We did not provide frequency response curves in order to avoid possible misunderstanding. The response curves commonly shown could not truthfully reflect a real response to a speaker system without thoroughly acknowledging every test condition. It can be very wrong if thinking a flat response in curve is really ��flat��. We need, at least, to consider the following facts: 1) Dispersive characteristics to drivers: We know a low bass has 360-degree radiation to every direction. The directivity is getting sharp to the front while higher test frequencies to the driver. Seldom tweeters can still remain ��30º (at �C5dB) dispersive angle to 10KHz or above. In short, driver��s radiating power is narrowing to the center front for higher frequencies. When we place a test microphone to the front of a speaker, a true flat system ought to indicate a little decline from high to low frequencies; with the weighting varies depending on each driver��s frequency vs. dispersion characteristics. 2) The influences of the wall and enclosure border: This is also a rather complicated factor to test results. For low bass frequencies, results vary against the wall, lifting height, and the reverberating conditions of the test room. If we place the speakers in an ordinary living room, tested variation may range even from 5 to 12dB!
Around the mid-low frequency band, test results are affected by the speaker front panel; acoustic radiation shall be transit from 4�� full-space (LF-end) condition to 2�� half-space (HF-end) condition, a 3dB measuring difference occurs during the transition. Take Maximus for example, the width of front panel is 21.5cm, about half-length to 790Hz; we found a drop tendency from 1/2�� to �� under 790Hz than higher frequencies. It is a reasonable consequence due to radiation space transition. If one��s tested curve is flat from 200Hz to 2KHz for instance, this may imply too strong an output within mid-low frequency band. 3) Consideration on loudness effect: Every audiophile must be quite familiar with the Equal Loudness Contours. It tells human ear how to feel loudness not only for different frequencies, but also under different sound levels. In general, we are quite insensitive for frequencies lower than 150Hz and higher than 7KHz. It is also possible having 8 to 10dB in loudness difference within 150Hz-7KHz too. This insensitivity to high-low frequency ends becomes more obvious while lower the sound level. This is the reason of ��loudness switch�� equipped to many amplifiers, for hearing loss compensation during low-level reproduction; although, it is not as accurate as we expected in most cases. 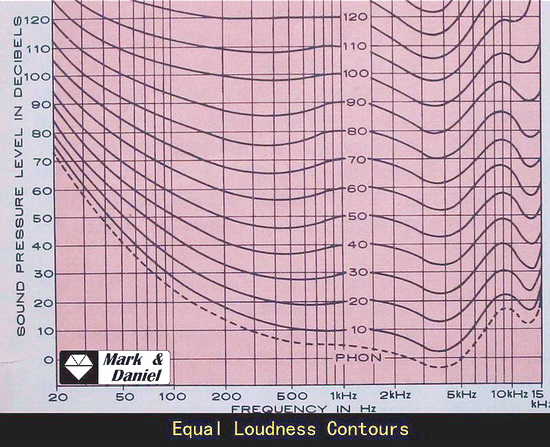
Every speaker maker has its own compensation logic to loudness variations of his system. Therefore, he also has his own ��secret recipe�� for fine-tuning to maker��s sound preference. Anyhow, one speaker��s frequency response curve may not be accurate as you thought. It should be used for limited reference only. It is very wrong to judge a speaker system by frequency response characteristics solely. Training yourself to analyze the general performances to a speaker system by listening is perhaps the best solution. [ BACK ]
|